
Mini Drama Analytics
This guide provides a centralized reference for your mini drama's performance analytics, designed to help you track and interpret key metrics. It details the specific data modules across monetization and operations to help you understand user behavior and revenue performance. All analytics modules can be found on your app page in the Developer Portal.
Available analytics modules
The developer platform offers analytics for the following modules found on your app page:
Category | Module | Navigation path |
Overview | Daily metrics | Overview page |
Monetization | In-App Purchases (IAPs) | Monetization > In-App Purchase tab |
In-App Ads (IAAs) | Monetization > In-App Ads tab | |
Analytics | Users | Analytics > Users toggle |
Performance | Analytics > Performance toggle |
Note: For all analytics modules, data is refreshed daily, but there may be a 2-day delay due to time zone differences and other factors.
- Settlement data: The figures displayed on the Developer Portal are risk-controlled T+1 data, while the TikTok Ads Manager (TTAM) backend shows real-time ad-side data. Actual settlements will be based on the Developer Portal data, with a typical discrepancy of 1% to 3% versus TTAM backend numbers.
- Campaign Model Optimization: We recommend referencing the TTAM backend for real-time operational adjustments.
Understanding data timeliness
Analytics data is not available in real time. Data timeliness refers to the time required to generate, process, and make data available for querying.
Processing schedules vary by metric. Some metrics are processed hourly, while others are processed daily or over a longer period. As a result, data for recent dates may be incomplete.
This section explains the typical update schedule for each type of data and how to determine whether the data you are viewing is complete.
Data update schedules
Data processing follows one of two update schedules:
- Daily updates
- Hourly or near-real-time updates
All times are in UTC. In the tables below, T represents the date on which the activity occurred, and T+1 represents the following day.
Note: The times listed below represent typical processing schedules and indicate when most data usually becomes available. They are not guaranteed and do not constitute a Service Level Agreement (SLA) or Service Level Objective (SLO). Updates may take longer when the developer platform processes large or complex datasets or encounters processing issues.
Daily updates
Most data is updated daily. Data generated on day T typically becomes available on day T+1.
Daily data is generally processed as a single batch. After it becomes available, it usually represents the final value for that day and does not continue updating throughout the day.
Data type | Metrics | Typical availability of data for day T |
Ad requests | Number of ad requests sent to the platform | From approximately 09:00 UTC on T+1 |
In-app purchase data | Total payment amount, refunds, net revenue, order counts—including top-up, exchange, and subscription orders—paying users, repeat paying users, average revenue per paying user (ARPPU), and lifetime value (LTV) | From approximately 09:00 UTC on T+1 |
User and retention data | User-volume and retention metrics, including next-day retention | From approximately 09:00 UTC on T+1 |
Creator Videos revenue and conversion data | Paid-traffic revenue, in-app purchase revenue, ad revenue attributed to videos, activated users, anchor impressions, anchor clicks, click-through rate, total task spend, cost per action (CPA), cost per mille (CPM), total videos, and total views | From approximately 12:00–13:00 UTC on T+1 |
Hourly or near-real-time updates
Some data is updated incrementally. Data generated on day T typically begins refreshing on day T+1 and may be updated several times throughout the day.
These updates are usually completed within 24 hours. Until processing is complete, the page may display data for only part of the selected period.
Data type | Metrics | Update frequency | Typical start time for data from day T |
Ad revenue data | Ad revenue and effective cost per mille (eCPM) | Near-real-time rolling updates | From approximately 00:00 UTC on T+1 |
Ad impression and click data | Ad impressions, ad clicks, and ad click-through rate | Hourly rolling updates | From approximately 08:00–09:00 UTC on T+1 |
Data readiness statuses
Analytics pages display a readiness status for each metric so that you can determine whether its data is complete for the selected date range.
Metrics on the same page may use different processing pipelines and become available at different times. For this reason, the developer platform assigns readiness statuses to individual metrics rather than to the entire page.
A metric can have one of the following statuses:
Status | Meaning | What you see on the page |
Pending | No data is available yet for the selected date range. | The metric displays |
Updating | Some data is available, but processing is not complete. | The metric displays the value available so far with an Updating label. The page also indicates the latest date or hour for which processing is complete. The value may change while the update is in progress. |
Ready | Data is complete for the selected date range. | No additional status label is displayed. |
How updates affect your data
- Data may change after it first becomes available. Delays in upstream data, reprocessing, cross-system aggregation, or data calibration may result in later updates to recent or historical data. Refer to the latest values displayed.
- Metrics on the same page may finish updating at different times because they can come from different processing pipelines. For hourly metrics, the developer platform displays completed periods first and adds subsequent hours as their data becomes available.
- When viewing yesterday’s data or other recent dates, some metrics may still be processing. For complete daily comparisons or summaries, check the data after the typical availability time listed for the corresponding data type.
Overview analytics
On the Overview section of your app page, you'll find a quick summary of your mini drama's main daily metrics.
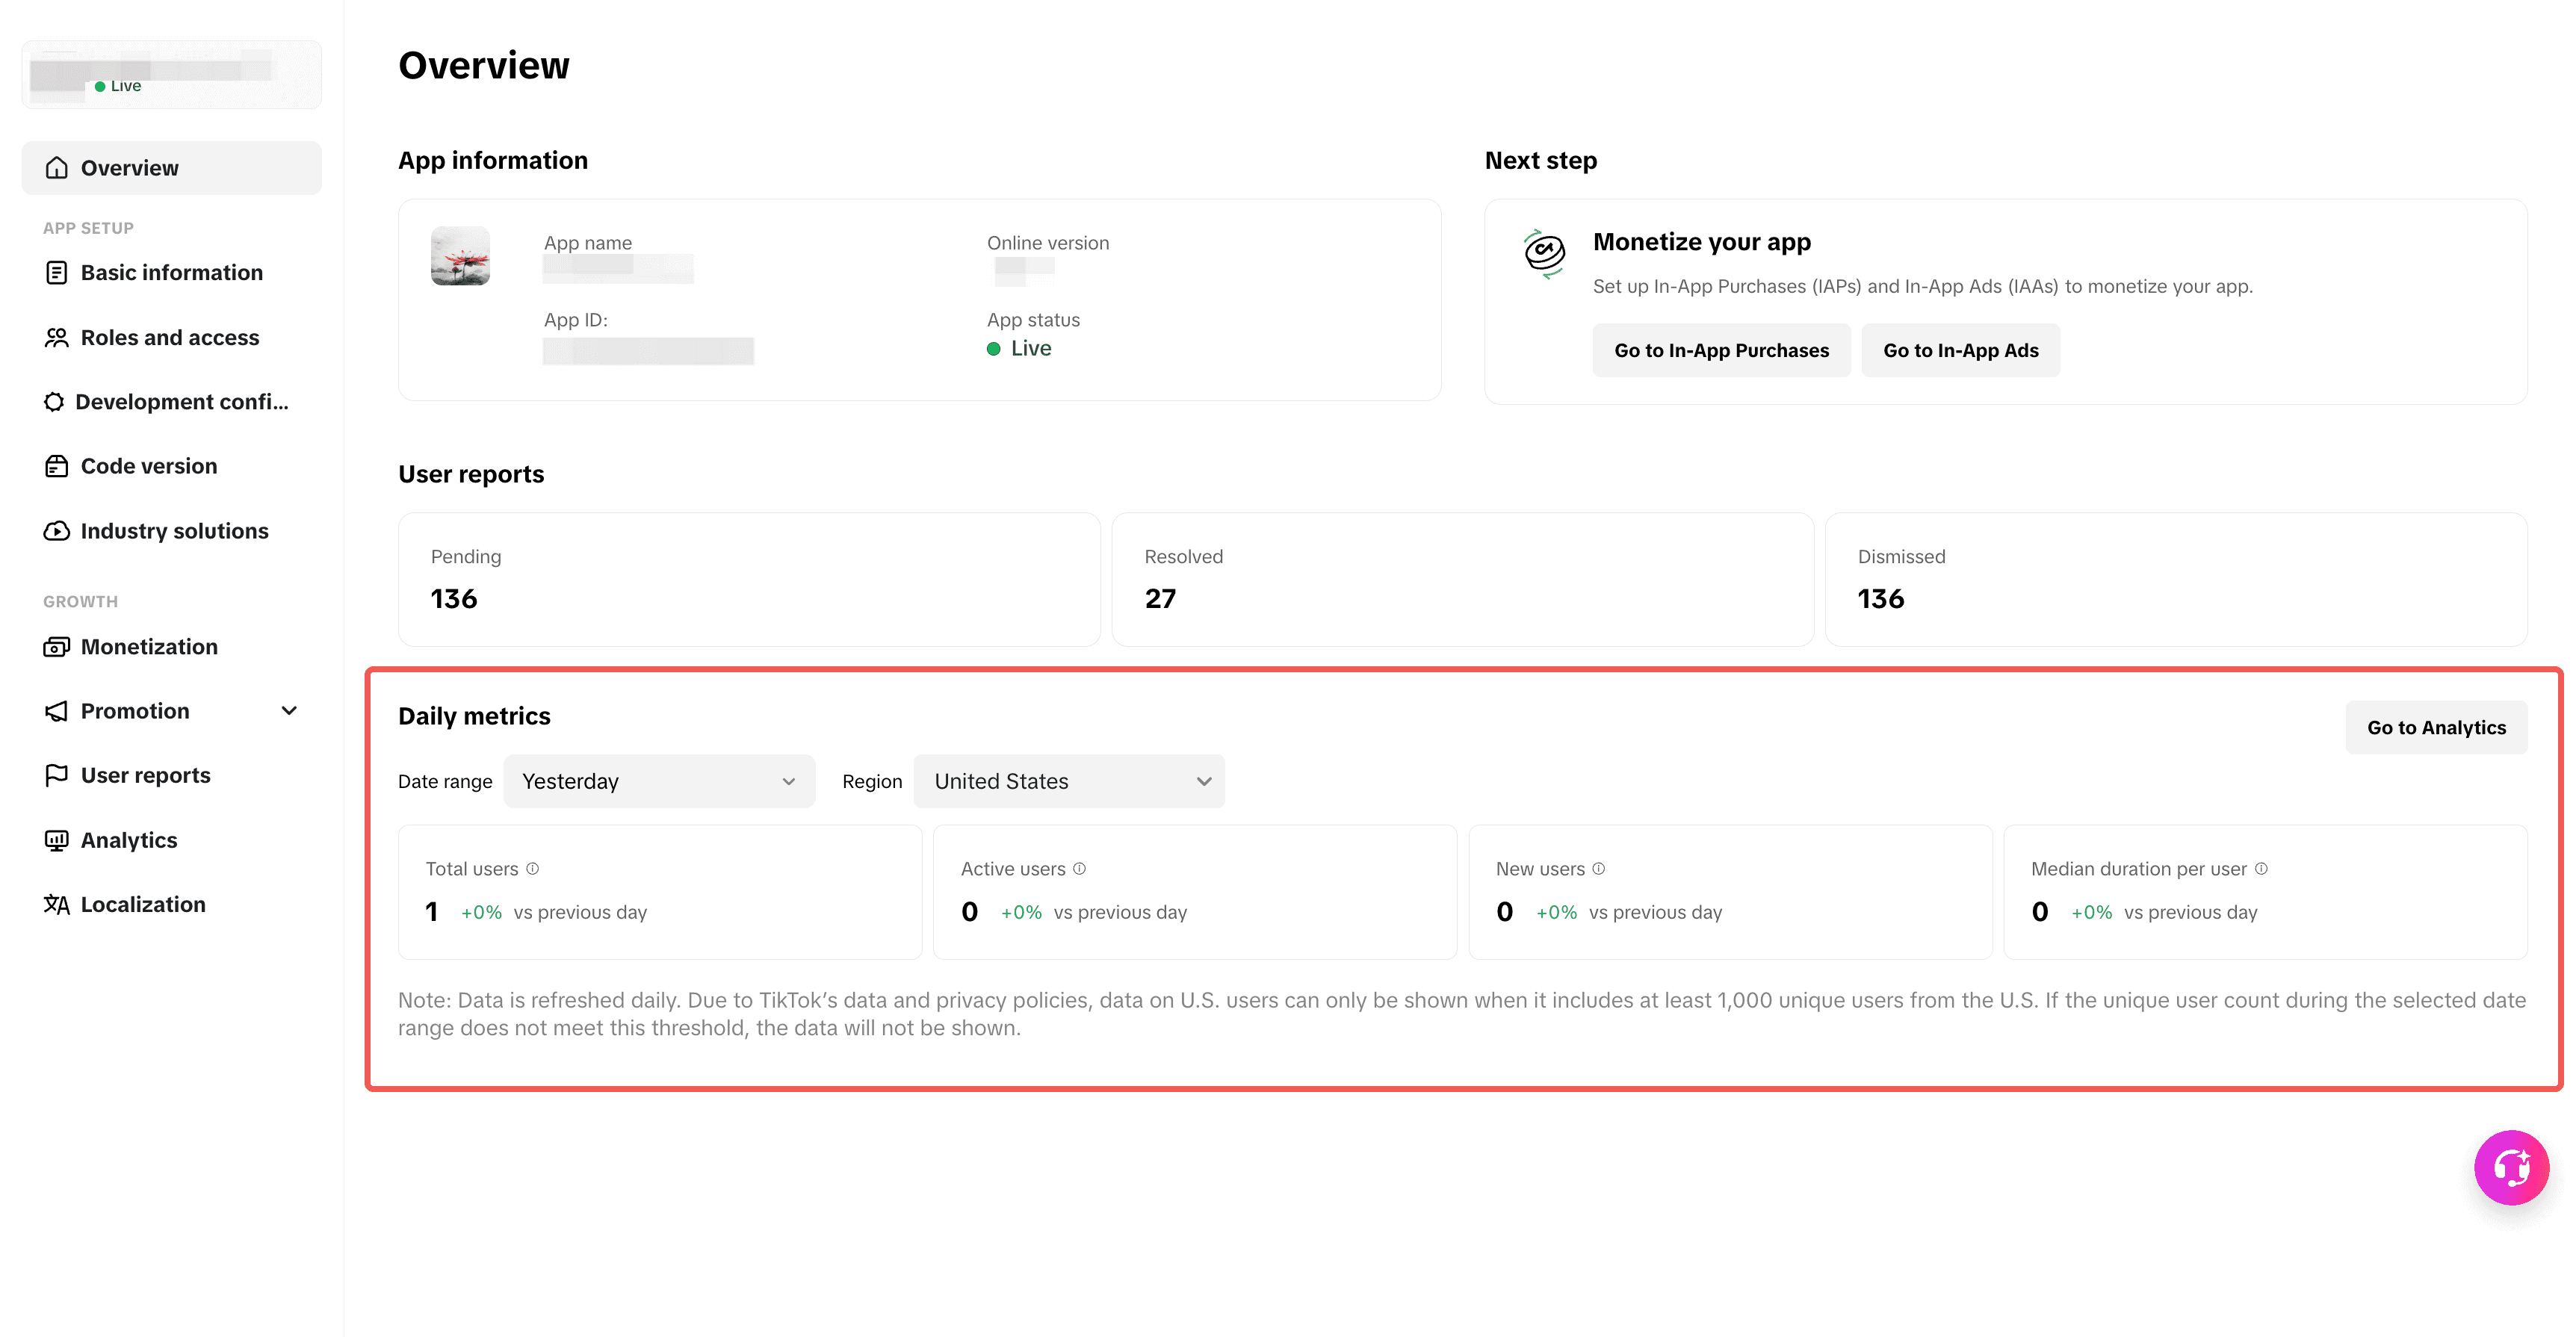
You can further refine your results by setting the Date Range and Region filters.
Metric | Description |
Total users | Total number of users that launched the app at least once till date |
Active users | Number of users who launched the app at least once (including new users) |
New users | Number of users who launched the app for the first time |
Median duration per user | Median time spent in the app per user |
For more detailed analytics, click the Go to Analytics button. This will navigate you to the analytics page for Operations.
Monetization analytics
In-app purchases (IAPs) data for mini dramas is available on your app's Monetization page. IAP analytics allow you to track metrics for both users and orders.
Note: For monetization analytics, data is deduplicated, meaning that redundant or duplicate data has been removed.
In-App Purchases
To find IAP analytics on your app page:
- Navigate to the Monetization dropdown from the sidebar.
- Click the In-App Purchases (IAPs) tab.
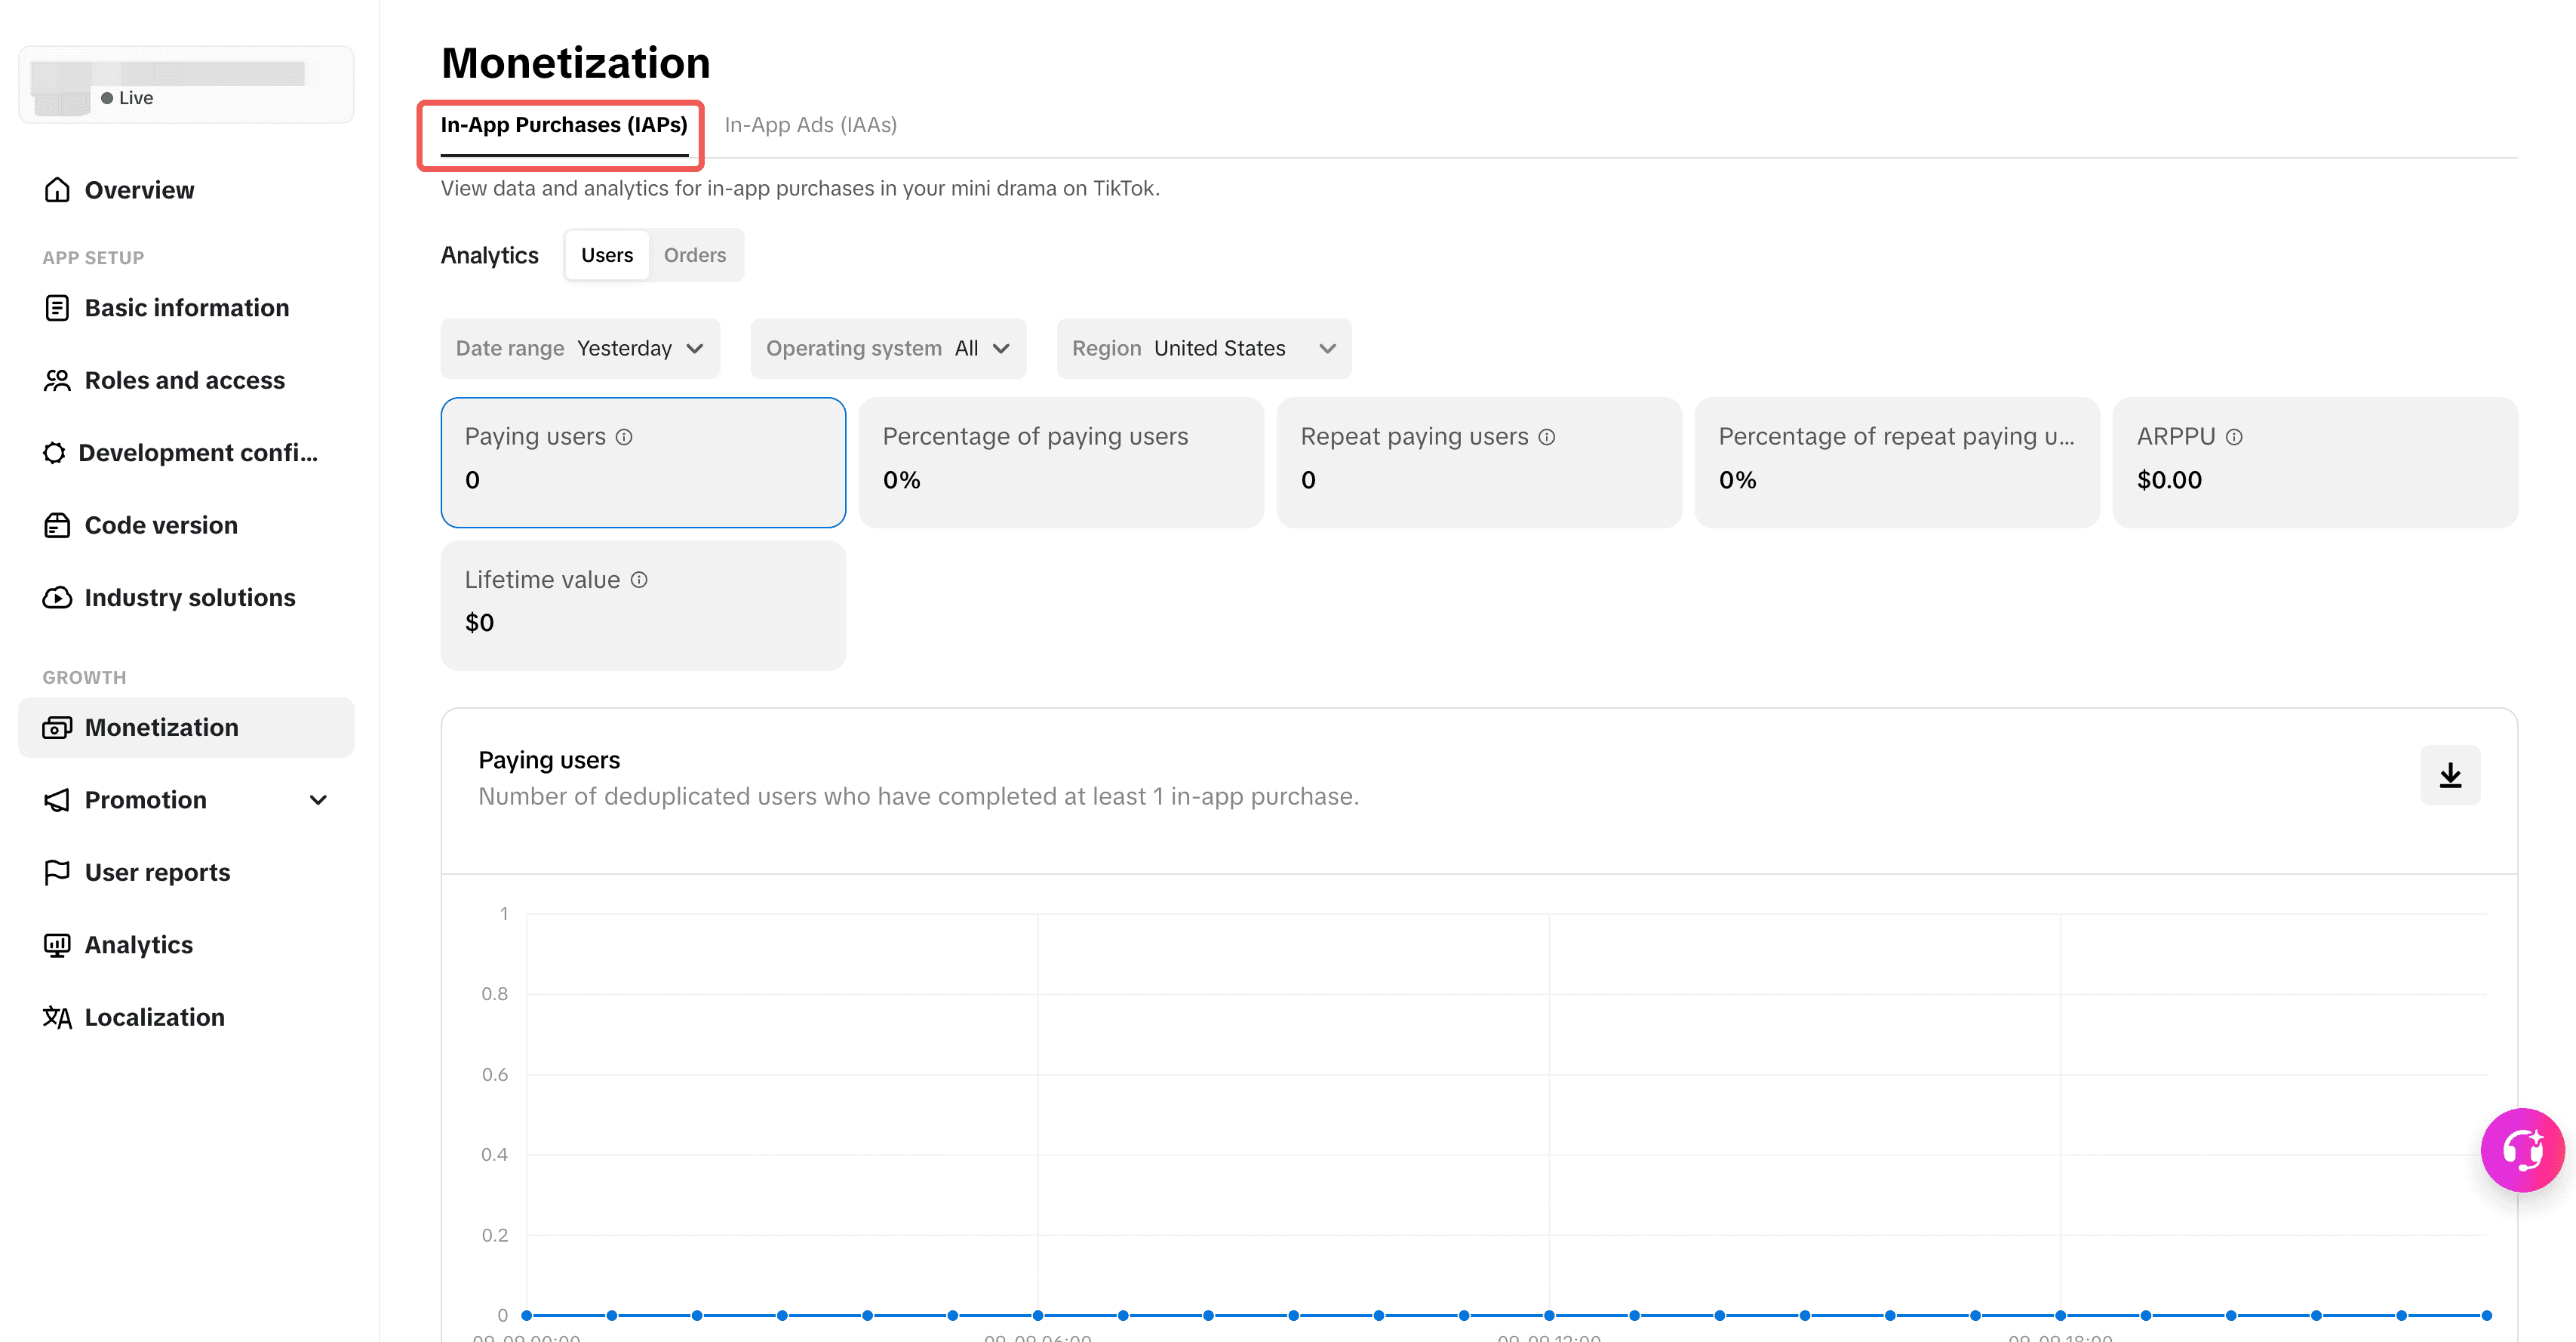
Choose what type of data you want to view by switching the toggle between Users and Orders. For both types of data, you can refine your results by setting the filters:
- Date range
- Operating system
- Region
- Payer type (Orders only)
User analytics
User analytics provides data on users who have made purchases in your mini drama.
Click on any one of the metrics to view it in line graph form. You can also download the data by clicking the Download button in the corner of the graph.
Metric | Description |
Paying users | Number of deduplicated users who have completed at least one in-app purchase |
Percentage of paying users | The proportion of users who have completed at least one in-app purchase |
Repeat paying users | Number of deduplicated users who have completed more than one in-app purchase |
Percentage of repeat paying users | The proportion of users who have completed more than one in-app purchase |
ARPPU | Average revenue per paying user |
Lifetime value | Average sales value generated by new users in the specified date range |
Order analytics
You can also analyze aggregate data for transactions.
Click on any one of the metrics to view it in graph form.
- GMV is viewable as a line chart or a pie chart.
- Redeem orders lets you view the top 10 most ordered products.
You can download the data by clicking the Download button in the corner of the graph.
Metric | Description |
GMV | Gross Merchandise Value (GMV) is the total sales value of the orders |
Average GMV | Average sales value per transaction |
Recharge orders | Number of times users purchased Beans to spend in the app |
Redeem orders | Number of times users used purchased Beans to unlock content |
In-App Ads (IAAs)
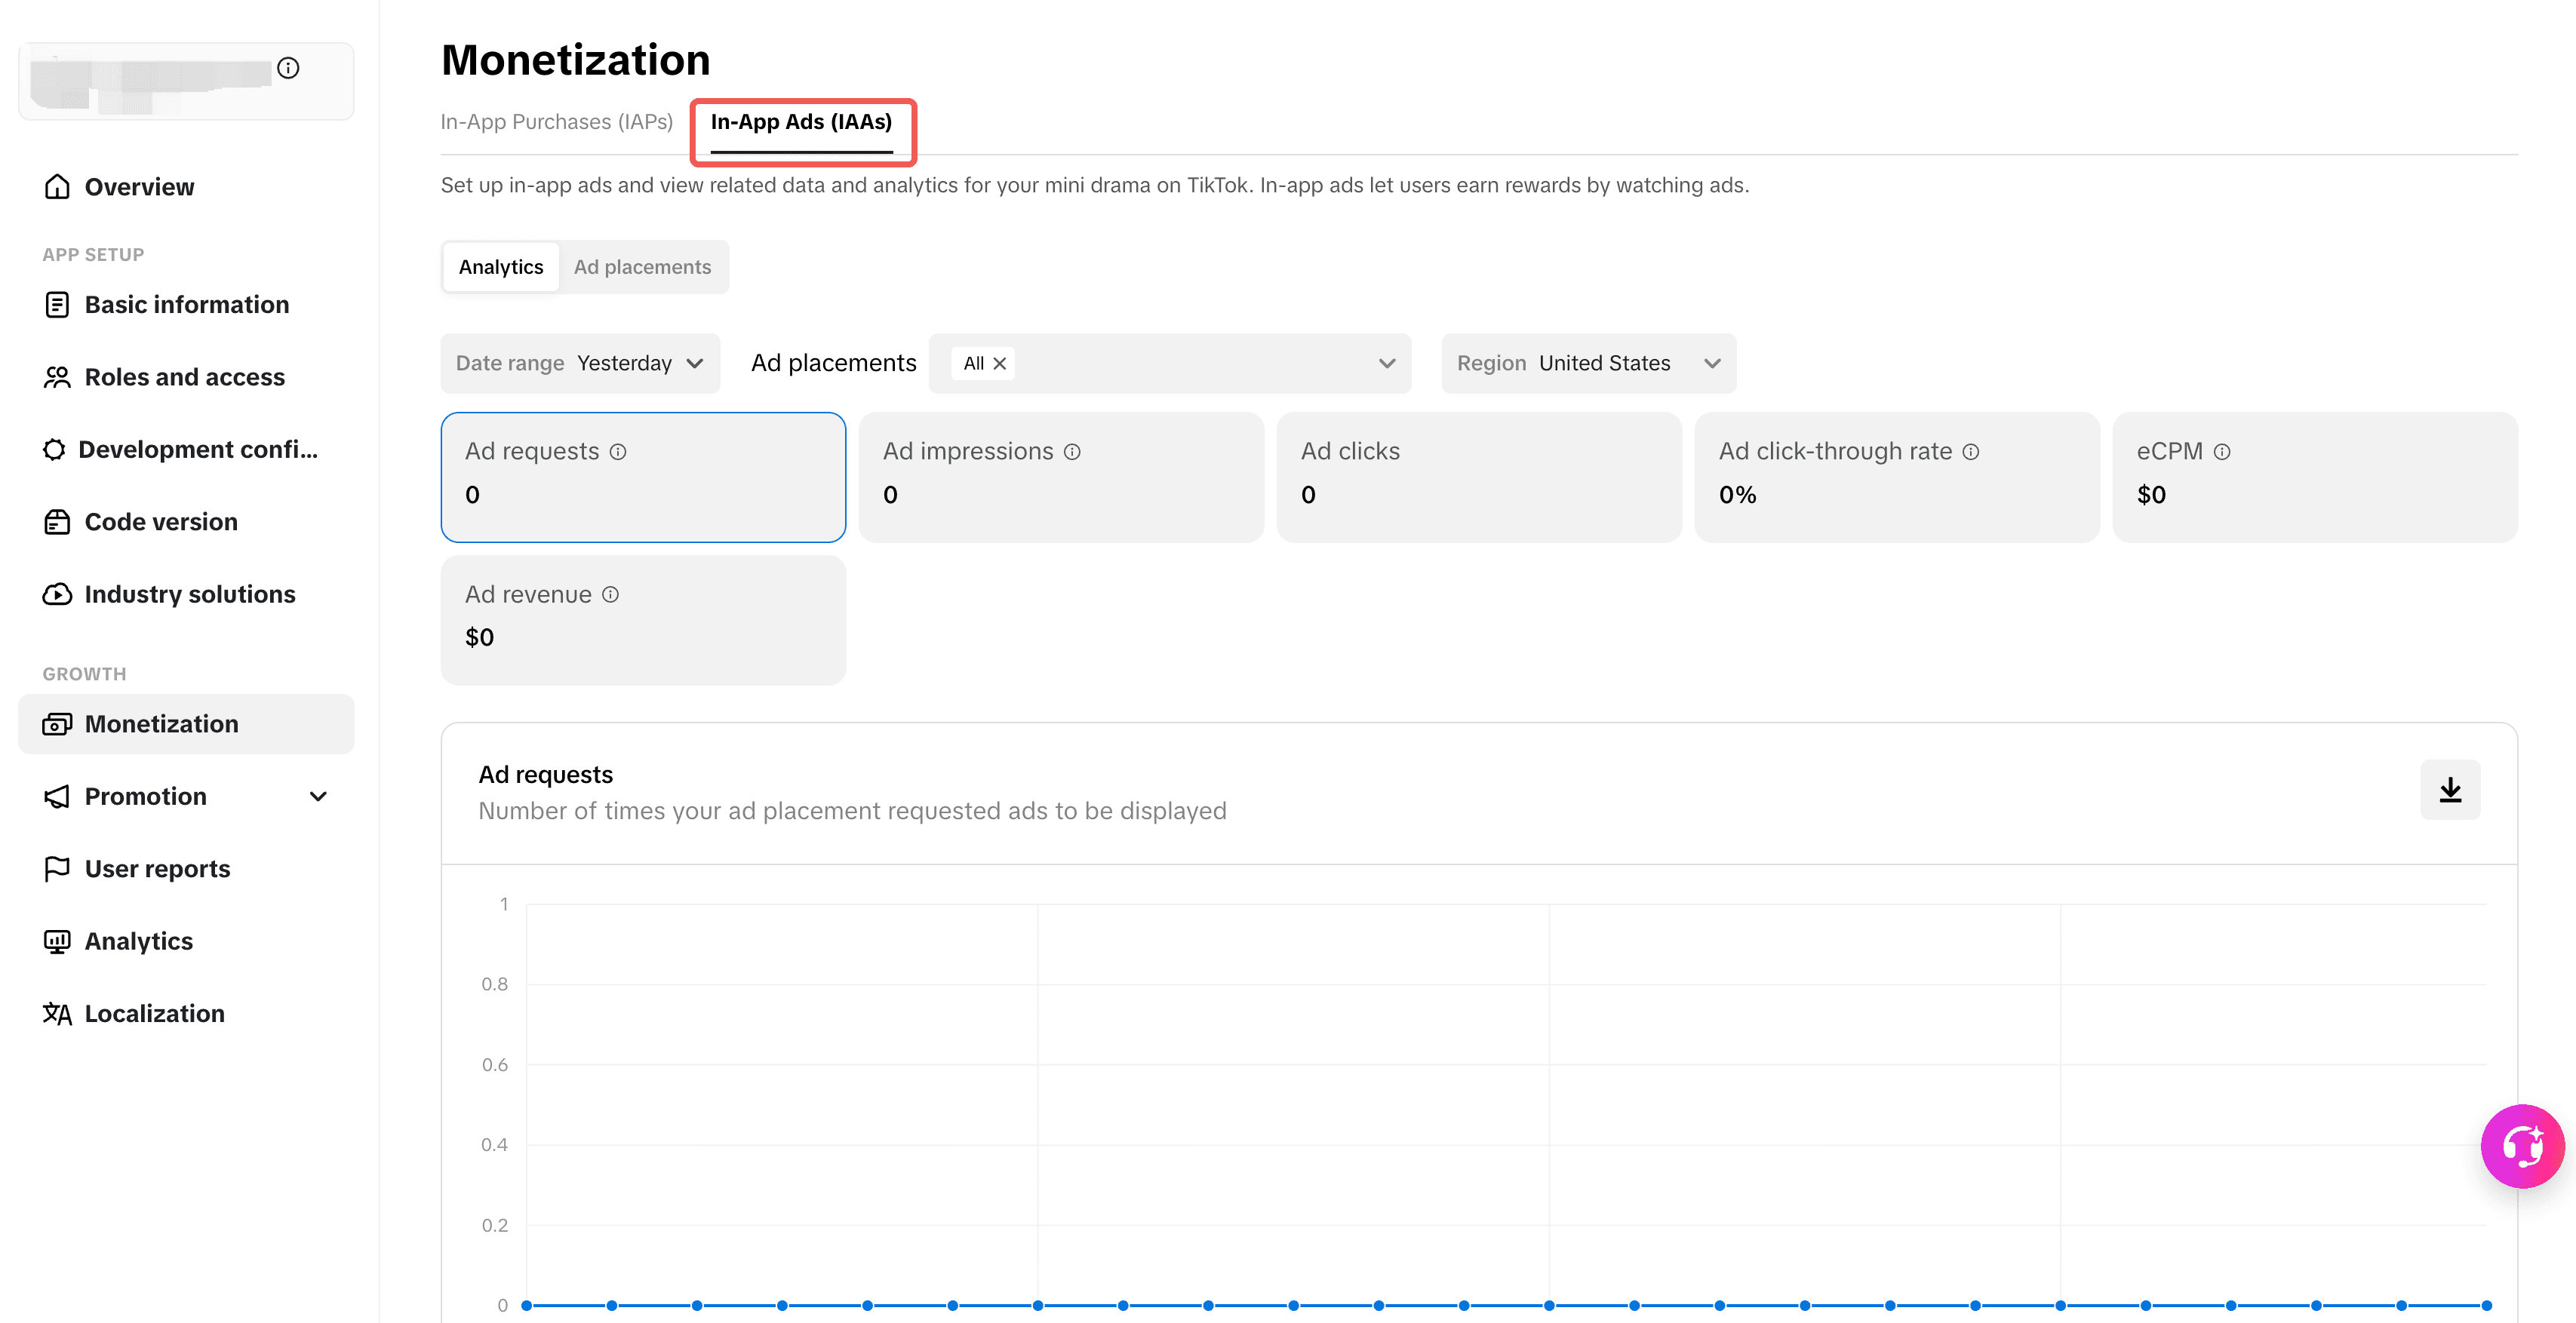
Refine your results by setting the filters:
- Date range
- Ad placements
- Region
Metric | Description |
Ad requests | Number of times your ad placement requested ads to be displayed |
Ad impressions | Number of times an ad is displayed |
Ad clicks | Number of times an ad is clicked |
Ad click-through rate | Percentage of users who clicked on an ad to the total number of users who viewed it |
eCPM | eCPM (effective Cost Per Mille) is the revenue earned per 1,000 ad impressions |
Ad revenue | Revenue generated from ads displayed, after platform fee deduction |
User analytics
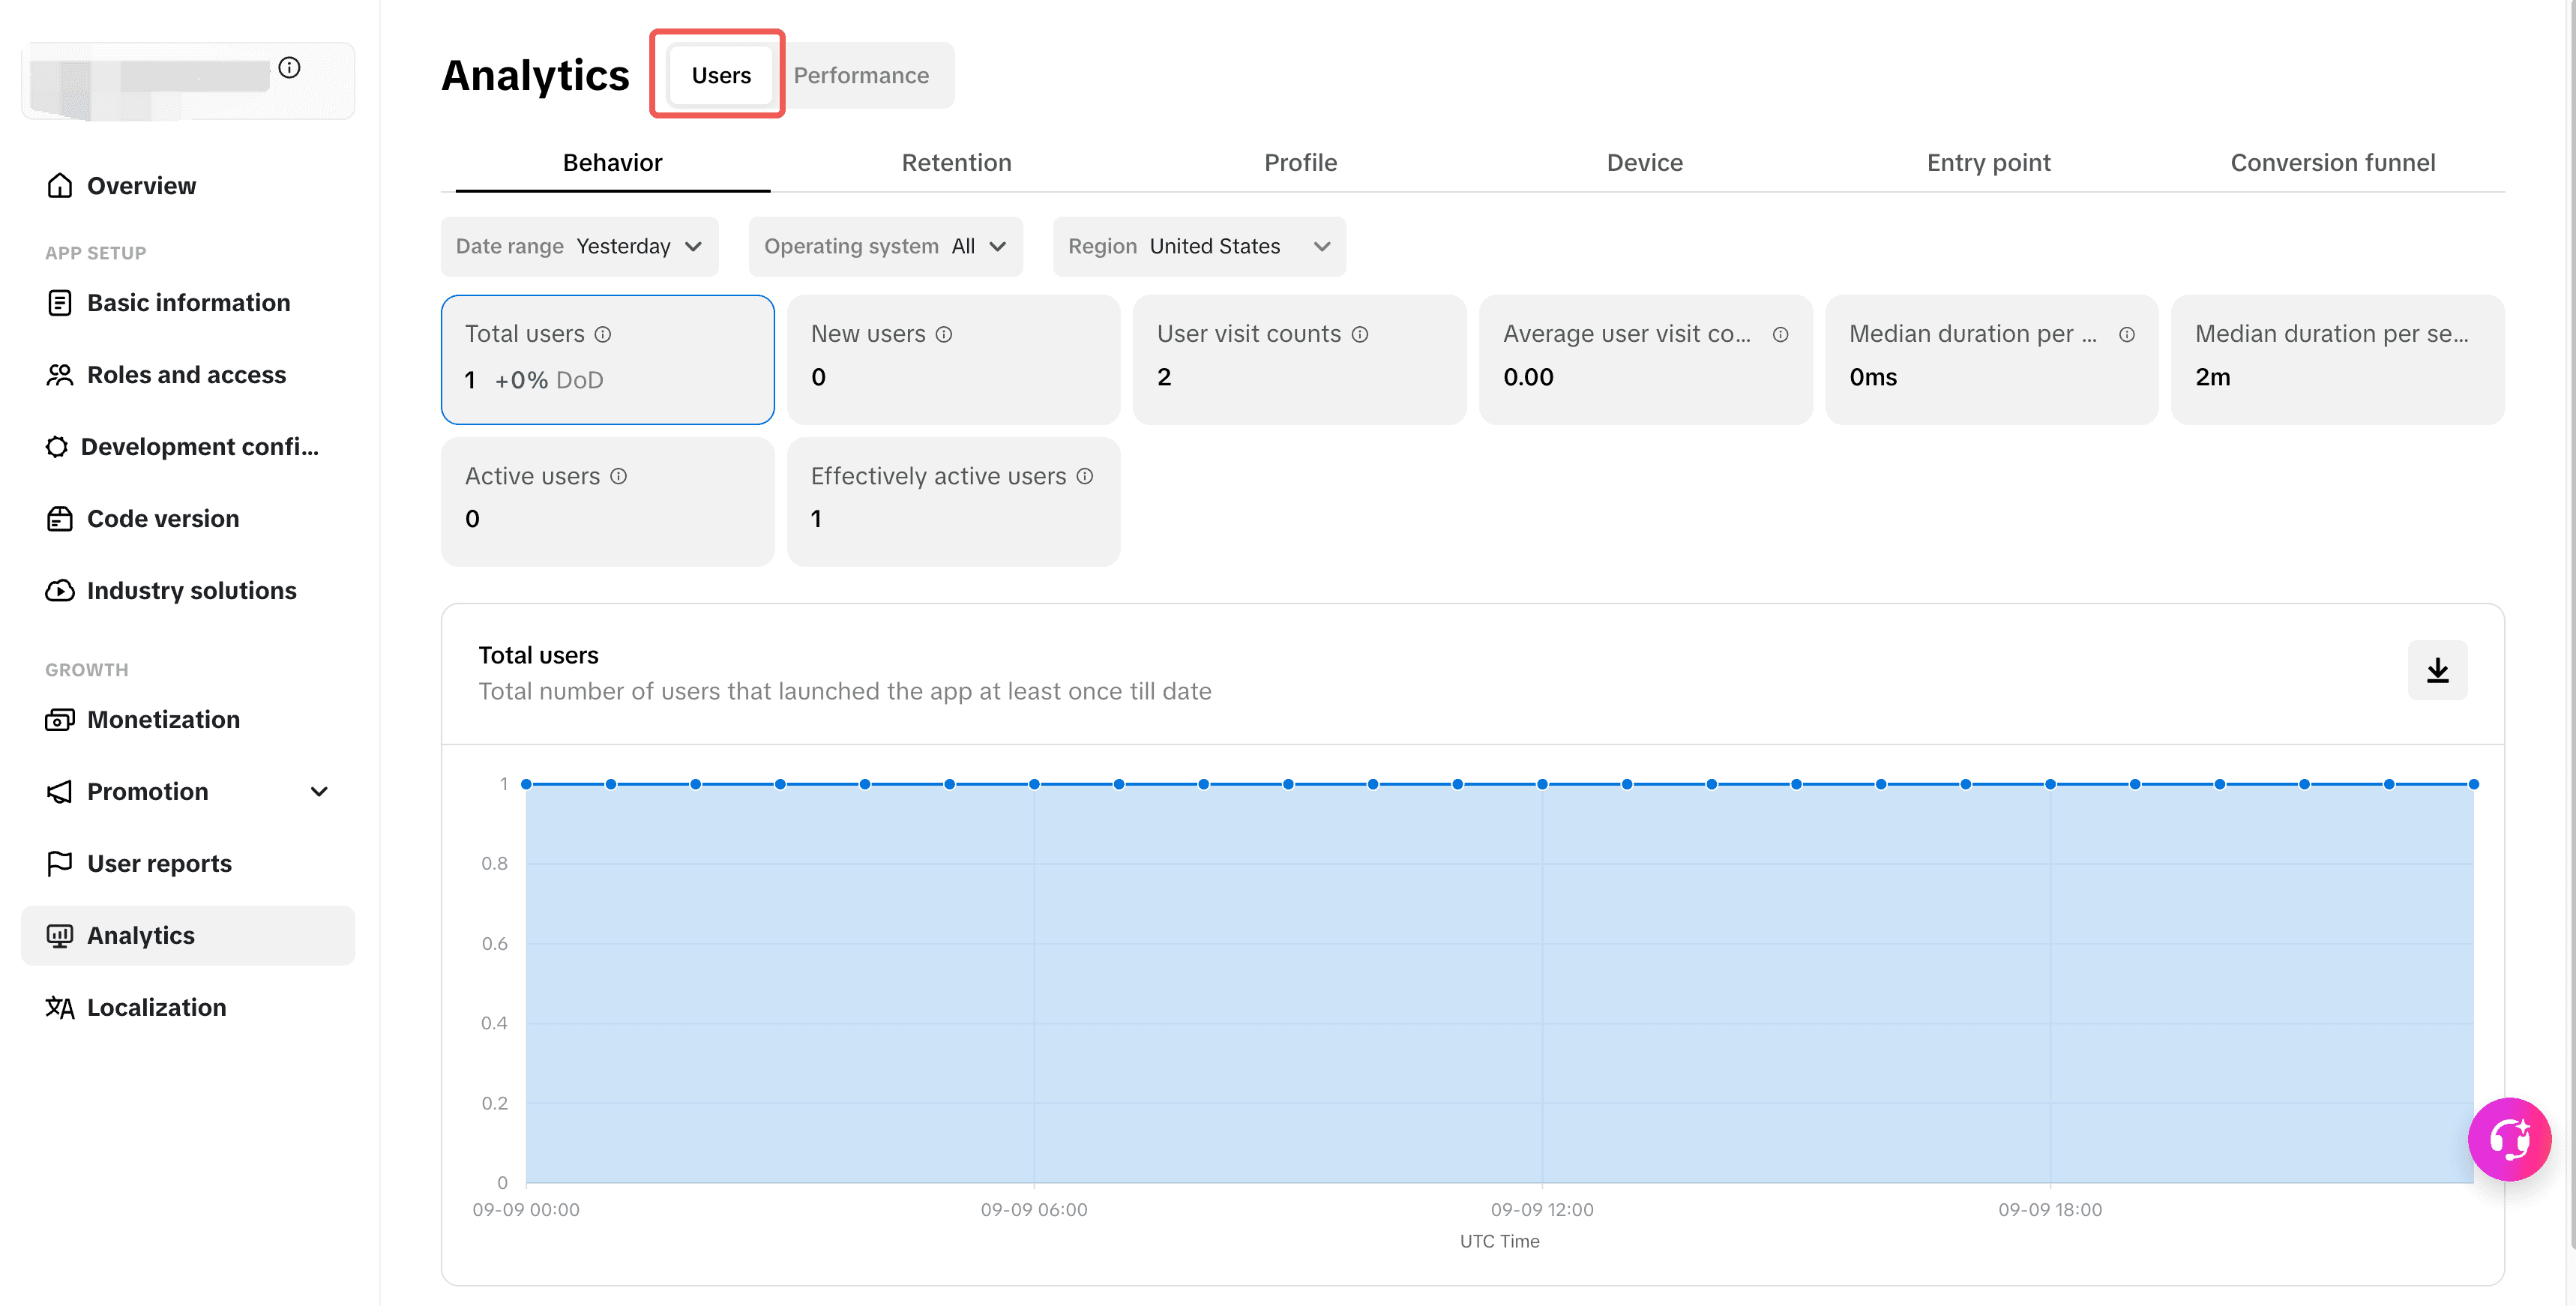
User analytics contains the following categories:
- Behavior
- Retention
- Profile
- Entry point
- Conversion funnel
Each category allows you to refine your results by setting the filters:
- Date range
- Operating system
- Region
- User type (Retention, Profile, and Device only. Selectable options depend on the category.)
- Order type (Conversion funnel only)
Behavior
Metric | Description |
Total users | Total number of users that launched the app at least once till date |
New users | Number of users who launched the app for the first time |
Repeat users | Number of users who launched the app more than once |
User visit counts | Number of times the app was launched |
Average user visit counts | Number of times the app was launched by each user on average |
Median duration per user | Median time spent in the app per user |
Median duration per session | Median time spent in the app per session |
Active users | Number of users who launched the app at least once (including new users) |
Effectively active users | Number of users who launched the app and spent time on it at least once (including new users) |
Retention
Retention is the number of users who remain active for however many days since they first launched the mini app. Select the retention period you want to display data for:
- 1-day
- 7-day
- 14-day
- 30-day
Profile
Profile analytics contain data for the following:
- Gender
- Age
- Region
Device
Device analytics contain data for the following:
- Brand
- Model
- TikTok app version
Entry point
Track where users enter the app. These metrics consider multiple touchpoints throughout the user journey, factoring in all actual interactions and assigning them equal weight.
- Active users
- New users
- Launch sessions
- Average duration per session
Conversion funnel
Evaluate user behavior across each stage of the conversion funnel to identify drop-off points and improve overall conversion rate.
- Entrance Exposure PV
- Entrance Click PV
- TT Minis Visit PV
- Last Free Episode Watch PV
- 3P Payment Panel Show PV
- 3P Payment Panel Click pV
- TT Payment Panel Show PV
- TT Payment Panel Click PV
- Consumption Order Cnt (Topup Order Cnt)
Performance analytics
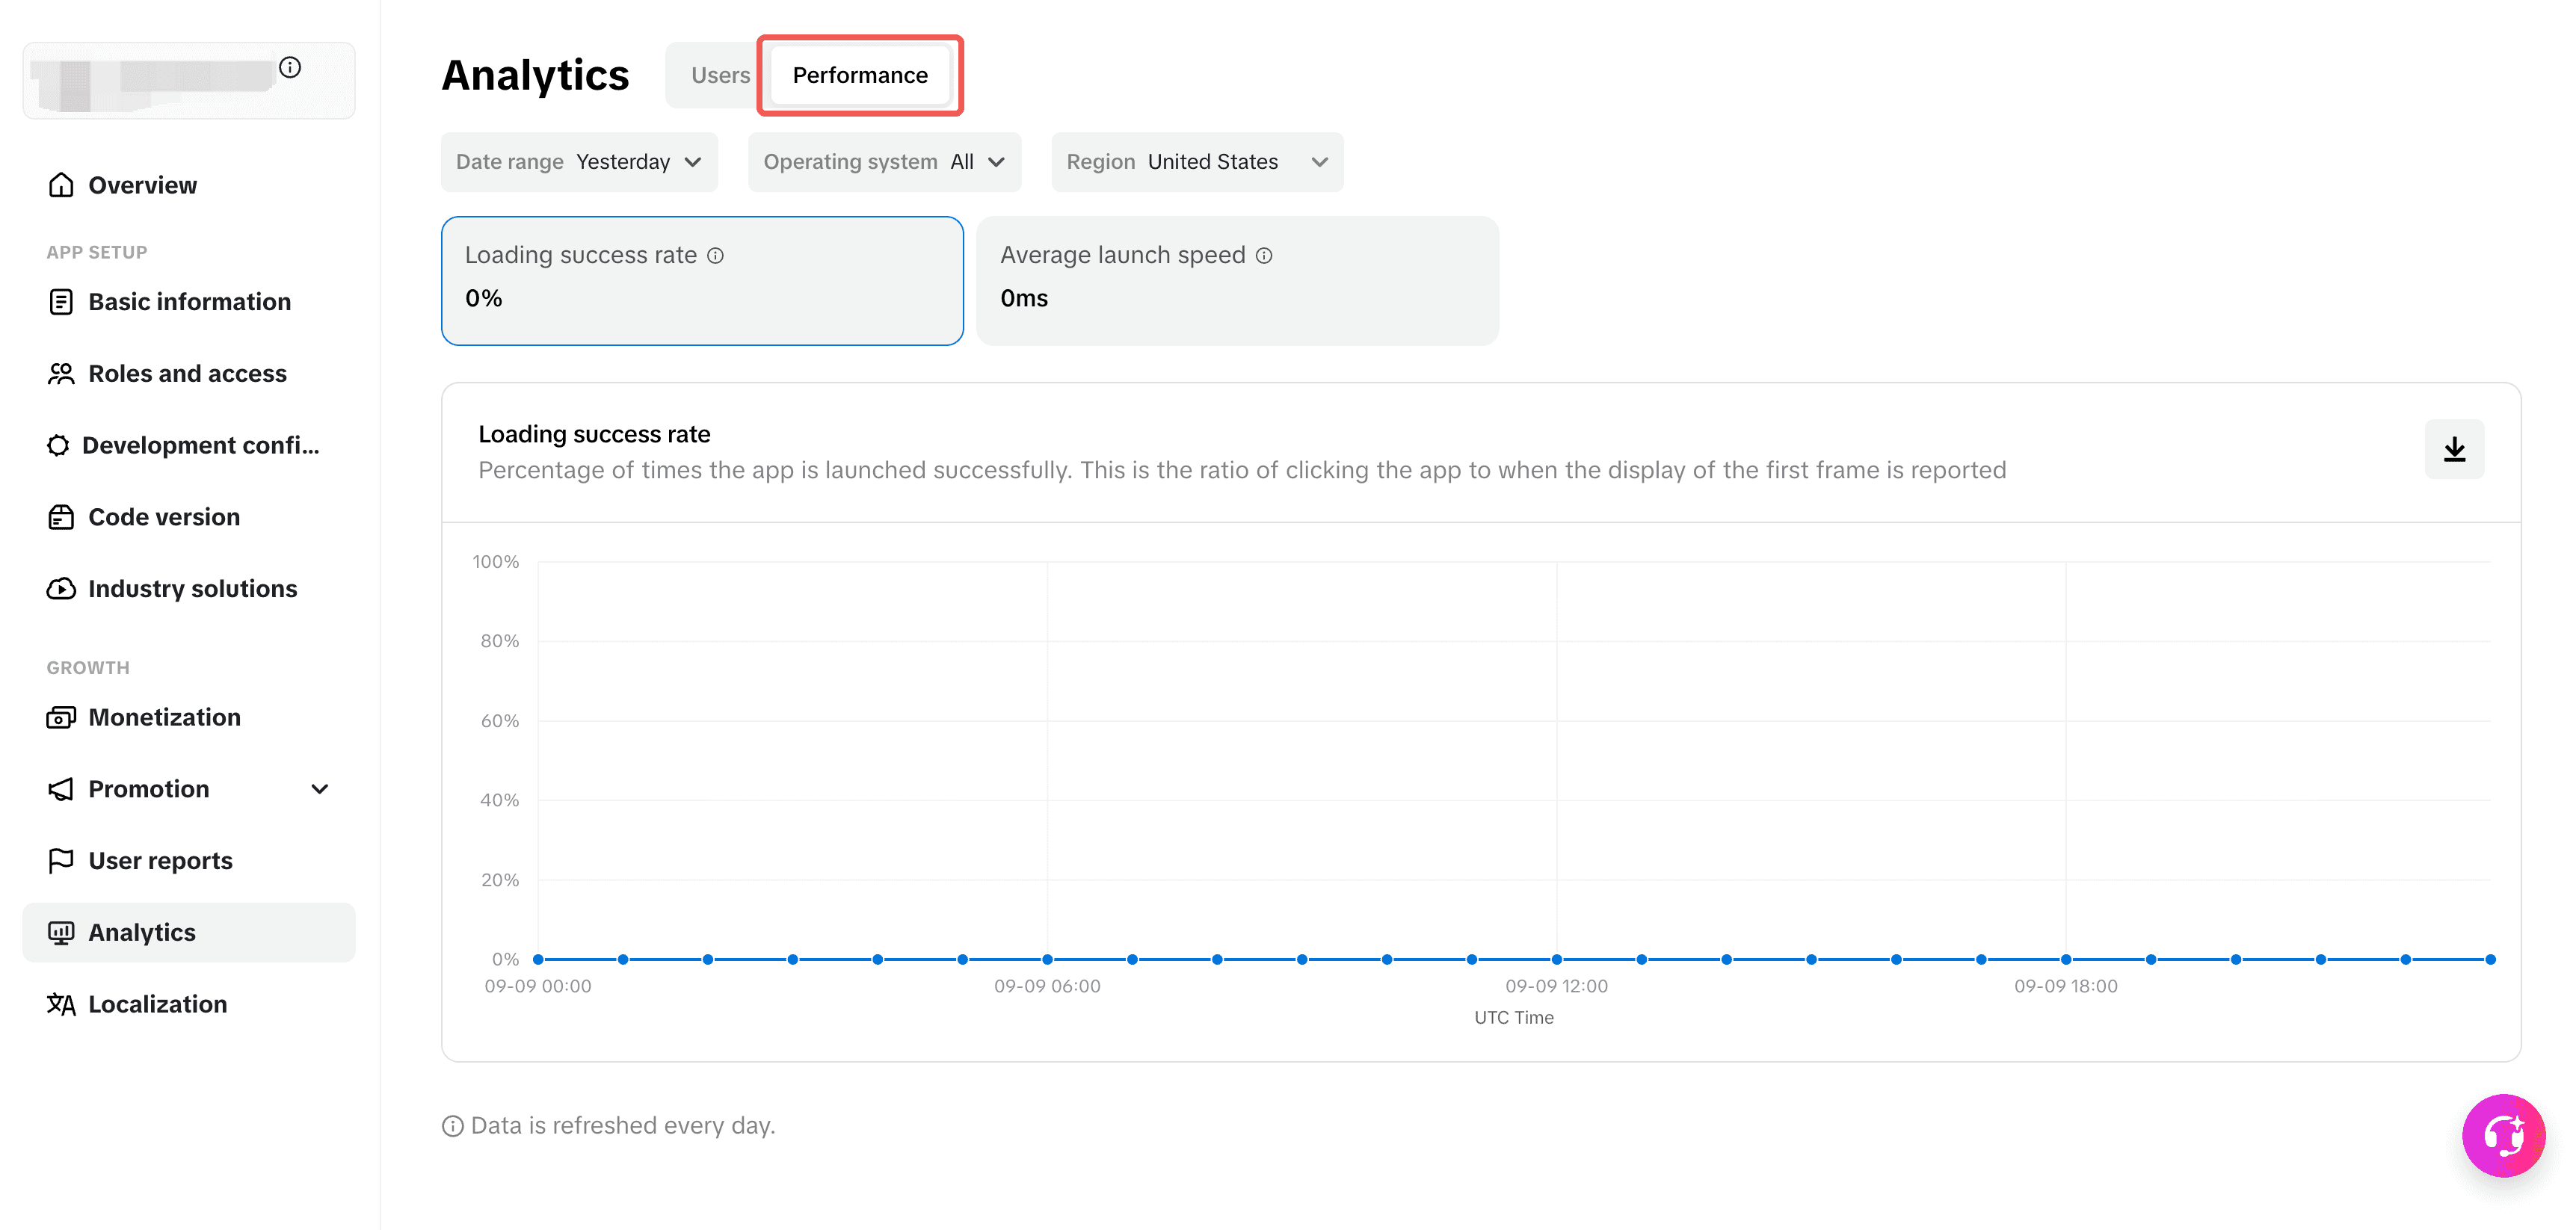
Track your app's launch speed and success rate in the performance analytics section.
Refine your results by setting the filters:
- Date range
- Operating system
- Region
Displayable metrics are defined below.
Metric | Description |
Loading success rate | Percentage of times the app is launched successfully. This is the ratio of clicking the app to when the display of the first frame is reported |
Average launch speed | Average app launch time (in milliseconds) |